NESDIS Blended Total Precipitable Water (TPW) Products
Blended TPW
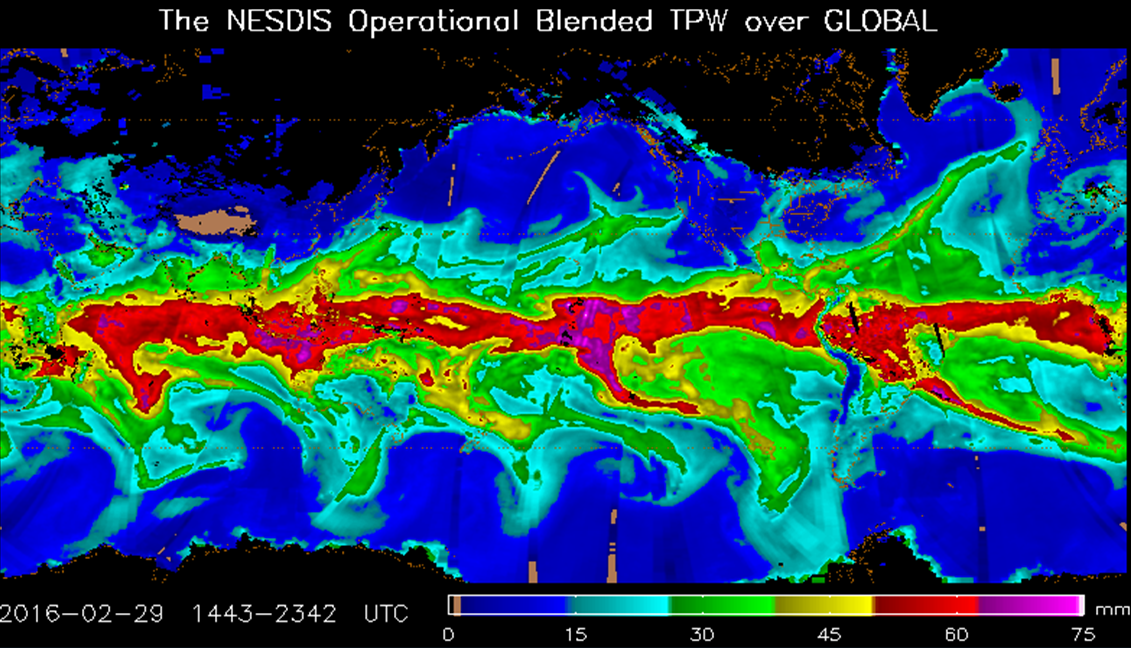 Global Blended TPW
The blended Total Precipitable Water (TPW) product is derived from multiple sensors/satellites. The Percentage of TPW normal (PCT), or TPW anomaly, shows the percentage departure of TPW from the NASA Water Vapor Project (NVAP) climatology (1988-1999). The blended products were merged from polar-orbiting and geostationary satellite sensors including: AMSU/MHS onboard the NOAA and MetOp satellite series; SSMIS onboard the DMSP satellite series; ATMS onboard S-NPP and NOAA-20; Sounder onboard the GOES satellite series; and GPS Met onboard Orbview-1. Individual biases of the data sources have been mitigated to produce a more meteorologically significant product. The blended methodology provides seamless global coverage without gaps to allow for the analysis of atmospheric moisture over land and ocean. The products are on a Mercator projection with 16 km resolution at the equator. The map is centered at the equator and 160 degrees W. It has 1437 lines and 2500 elements, which covers the earth from about 71 degrees N to 71 degrees S. The products are hourly in HDF-EOS and NetCDF file formats. Also, included are PNG images of the products generated per hour over the globe and 14 local regions. These operational products were produced by the NOAA/NESDIS Office of Satellite and Product Operations (OSPO). The TPW/PCT products have been operational since 2009, however, the archive period of record begins in 2013.
- Cite this dataset when used as a source.
- gov.noaa.class:BLENDHYDRO
- gov.noaa.ncdc:C00803
C00803
| Order Data |
|
| Distribution Formats |
|
| Ordering Instructions | Contact NCEI for other distribution options and instructions. |
| Distributor | NOAA National Centers for Environmental Information
ncei.info@noaa.gov |
| Dataset Point of Contact | Customer Engagement Branch
DOC/NOAA/NESDIS/NCEI > National Centers for Environmental Information, NESDIS, NOAA, U.S. Department of Commerce +1 828-271-4800 class.help@noaa.gov |
| Time Period | 2013-10-01 to Present |
| Spatial Bounding Box Coordinates |
N: 71.0
S: -71.0
E: 180.0
W: -180.0
|
| Spatial Coverage Map | |
| Dataset Information |
|
| General Documentation |
|
| Processing Documents |
|
| Publication Dates |
|
| Data Presentation Form | Digital image
|
| Dataset Progress Status | Ongoing - data is continually being updated |
| Data Update Frequency | Continual |
| Purpose | This dataset provides quality measurements of hydrometeorological variables from multiple instruments and platforms. |
| Use Limitations |
|
| Dataset Citation |
|
| Cited Authors |
|
| Originators |
|
| Principal Investigators |
|
| Publishers |
|
| Theme keywords | Global Change Master Directory (GCMD) Science Keywords
|
| Data Center keywords | Global Change Master Directory (GCMD) Data Center Keywords
|
| Platform keywords | Global Change Master Directory (GCMD) Platform Keywords
|
| Instrument keywords | Global Change Master Directory (GCMD) Instrument Keywords
|
| Place keywords | Global Change Master Directory (GCMD) Location Keywords
|
| Data Resolution keywords | Global Change Master Directory (GCMD) Horizontal Data Resolution Keywords
|
| Use Constraints |
|
| Access Constraints |
|
| Fees |
|
| Lineage Statement | The data were produced by the NESDIS Office of Satellite and Product Operations (OSPO) and are archived at the NOAA National Centers for Environmental Information (NCEI). |
| Processor |
|
| Processing Steps |
|
| Processing Documents |
|
| Processing Steps |
|
Last Modified: 2023-06-23
For questions about the information on this page, please email: ncei.info@noaa.gov